The order book, event by event, on Sierra Chart.
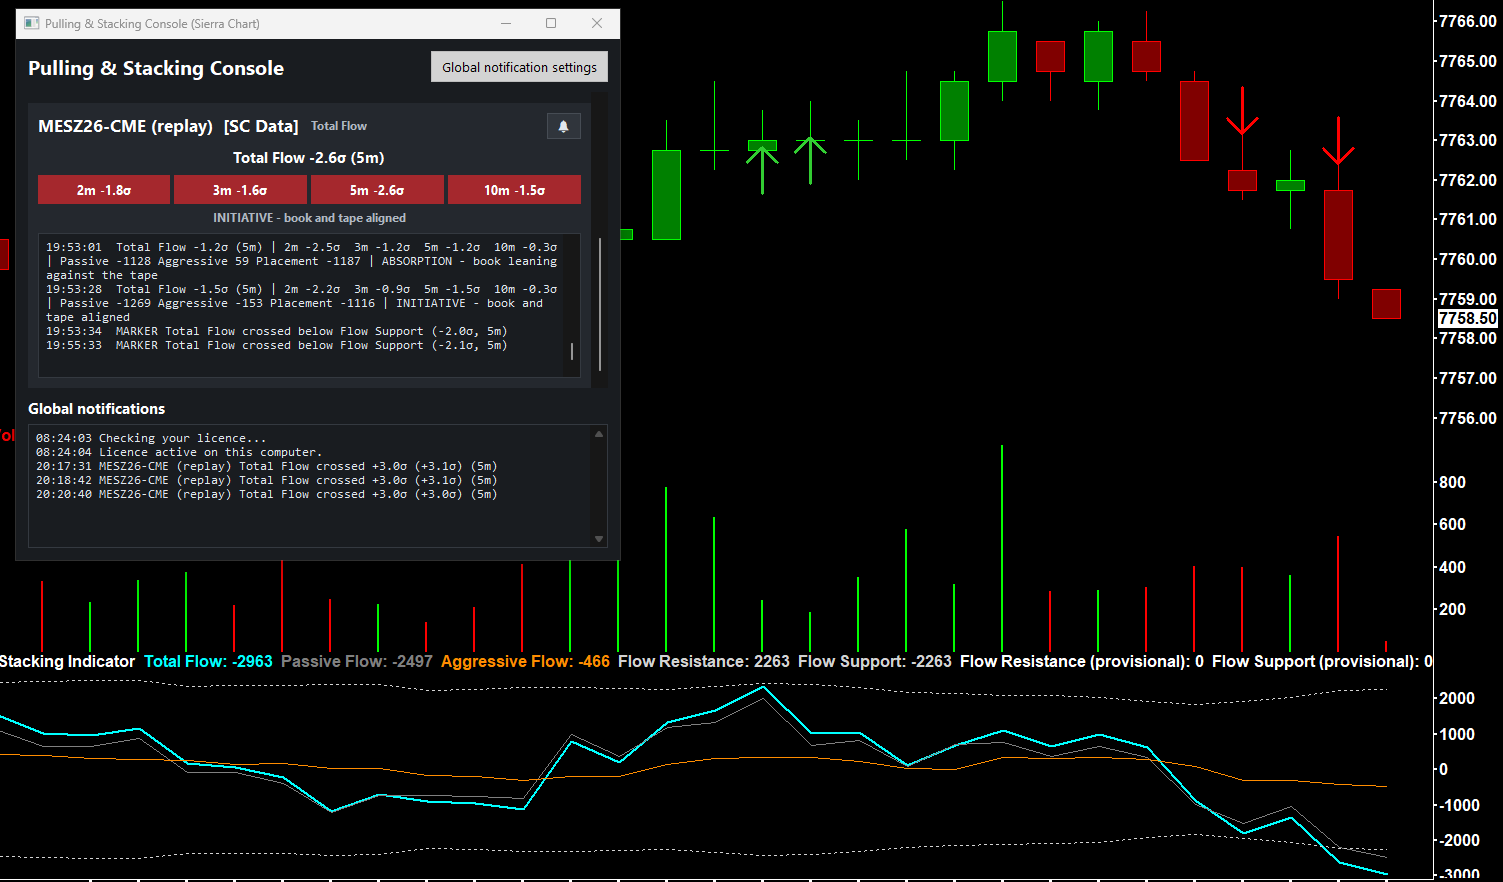
The Pulling & Stacking Indicator is a custom study for Sierra Chart. It decomposes every resting order stacked or pulled, and every aggressive execution, into one normalized signal, drawn in its own chart region under the price.
What it adds to Sierra Chart
Flow under the price
Total Flow, Passive Flow and Aggressive Flow update on every order book change and every trade, with no smoothing and no lagging average. Arrows on the price chart mark the moments the flow crosses its band.
Buy and sell lines
Switch to Buy / Sell mode to plot buy-side and sell-side flow as separate lines, so one side going vertical while the other flatlines is visible instead of netted away.
The console
The Pulling & Stacking Console opens next to your charts, with one tile per symbol, so you can follow several charts in one place.
Install
Install in short
Download the Sierra Chart zip from your Stack Signal account and unzip it. Copy PullingAndStackingIndicator_64.dll into the Data folder of your Sierra Chart installation, usually C:\SierraChart\Data. Open a chart, choose Analysis > Studies, click Add Custom Study and add Pulling & Stacking Indicator. Accept the Terms and Conditions, then enter your licence key in the study settings.
Requirements
- Sierra Chart, 64-bit, on Windows.
- A data feed with Level 2 market depth (the order book) and Time & Sales that identifies the side of each trade. Level 1 is not enough.
- In Sierra Chart, leave Max Depth Levels (Global Settings > Sierra Chart Server Settings) at 30 or more, or at 0 for all levels.
- An internet connection while the indicator runs, to confirm the licence (see the indicator privacy policy).
- One licence key works on one computer at a time.
Replay
Live data, and Chart Replay at 1x or 2x. At faster speeds the indicator pauses until the replay is back at 2x or slower. Replay needs the market depth data Sierra Chart recorded for the day being played: without it, Passive Flow stays near 0.