Getting started on Sierra Chart
The indicator for Sierra Chart is one file, PullingAndStackingIndicator_64.dll,
for the 64-bit Sierra Chart on Windows. It needs a data feed that provides market
depth (the order book) and Time & Sales, with the side of each trade, for the
instrument. It works on live data and on Chart Replay at 1x or 2x (see
limitations).
Install
- Download the Sierra Chart zip from your Stack Signal account and unzip it. It
holds the DLL, a
.sha256file with its checksum, andINSTALL.md. To check the file on Windows, open PowerShell in that folder and run(Get-FileHash PullingAndStackingIndicator_64.dll).Hash -eq (Get-Content PullingAndStackingIndicator_64.dll.sha256).Split()[0].ToUpper(). It printsTruewhen the file matches. (Get-FileHashprints the hash in capitals and the.sha256file has it in small letters followed by the file name; the command compares the two.) The files are not code-signed, so Windows SmartScreen or your antivirus may warn you. Check the hash first, then allow the file (for the downloaded zip: right-click it, Properties, Unblock). - Copy
PullingAndStackingIndicator_64.dllinto theDatafolder of your Sierra Chart installation, usuallyC:\SierraChart\Data. Do not rename it: Sierra Chart only loads custom studies whose file name ends in_64.dll. - If an earlier version was installed, replace the old file, then restart Sierra Chart: File > Save All, then File > Exit, and start Sierra Chart again. Every chart then loads the new version. If Windows says the file is in use, exit Sierra Chart first, copy the file, then start it. (See Updating under Platform notes for replacing it without a restart.)
The indicator itself asks only for the licence key from your Stack Signal email. Two Sierra Chart settings affect what it reads: Max Depth Levels, in Global Settings (every chart), and the chart update interval, which is set in two places, Global Settings and the chart's own Chart Settings (see Market depth and Chart update interval under First chart).
First chart
- Open a chart of the instrument you trade.
- Choose Analysis > Studies (or press F6) and click Add Custom Study.
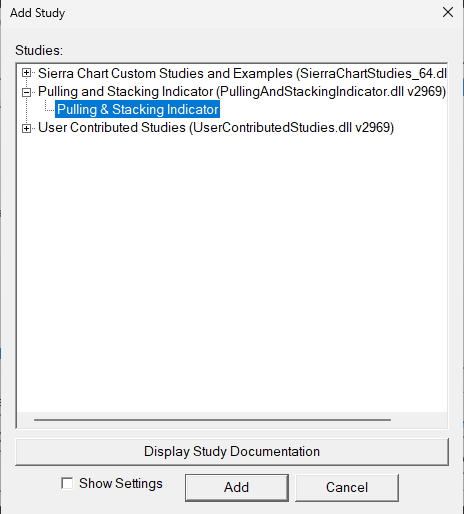
- Expand Pulling and Stacking Indicator (click the + beside it), select
Pulling & Stacking Indicator, click Add, then OK. The study
draws in its own panel under the price chart. Sierra Chart may first put it
in Chart Region 2, the Volume panel (the settings window you see while
adding it can show
2); when the study starts, it moves itself to the first Chart Region no other study uses, usually Chart Region 3, under the Volume panel. If it still shares a panel with another study, change Chart Region in the study's settings to an unused region.
The terms, the first time. The indicator checks for the current Terms and
Conditions. Sierra Chart's Message Log (Window > Message Log) shows
CHECKING CONFIGURATION: the terms window opens when this completes. After about
a second (up to 10 seconds without an internet connection) the Terms and
Conditions window opens. The terms come with the indicator, so you can accept
them offline. Read them and click I accept the Terms and Conditions. On a
computer where the terms are already accepted, the line reads
CHECKING CONFIGURATION: the indicator starts when this completes. and no terms
window opens. A chart that loads while the licence is still being checked may
write the tile's PAUSED - checking your licence line instead.
Until you accept, the indicator draws nothing and the console does not open. Not now, or closing the window, puts it away until Sierra Chart loads the indicator again (for example after a restart of Sierra Chart); adding the study to another chart does not bring it back.
To read the terms again later, set Show Terms and Conditions to Yes and click
Apply. The terms window opens; once you have accepted the current terms it
says, for example, You accepted these terms on 28 October 2026. (the date you
accepted them) and has a single Close button, and closing it changes nothing.
When you open the settings again, Show Terms and Conditions is back at No.
The lines are drawn in their own panel under the price chart, and the arrows on
the price chart. The Pulling & Stacking Console opens in front of the
chart, with one tile per symbol; move it where you like, and it opens there next
time. When a Sierra Chart dialog closes, Sierra Chart's window comes back in front
and can cover the console: point at Sierra Chart's icon on the Windows taskbar and
click the console's thumbnail, or set Console Always On Top to Yes. Until you activate your licence (next section), the
tile shows PAUSED - licence required (see the study settings) and the chart
stays empty. Once it is active, the tile shows WAITING FOR ORDER BOOK DATA, then
WARMING UP; with the default settings the Resistance and Support band needs
about 25 minutes of data (see indicator states). On the chart the lines
start at the present bar: the bars Sierra Chart downloads when it starts (the
time it was closed) stay blank. The lines are drawn grey at 0 until the first
window has been seen (5 minutes of live data at the default Primary Window),
then in their colours.
Market depth. The indicator reads up to 30 levels per side, or three times
Level Depth if that is more, so leave Global Settings > Sierra Chart Server
Settings > Max Depth Levels at 30 or more (three times Level Depth above a Level
Depth of 10), or at 0 (all levels). If the feed sends no depth, the console tile
stays at WAITING FOR ORDER BOOK DATA or says that no Level II depth was received
(see indicator states). When you change Level Depth and
click Apply, the Message Log line says how many levels per side the feed gives
at that moment (the change starts the warm-up again, so check before your
session), for example
Pulling & Stacking BTCUSDT_PERP_BINANCE: Level Depth 20, count levels entering the depth No. The warm-up starts again. The book is read up to 60 levels per side; the feed gives 40 bid and 40 ask levels now.
A Level Depth above 100 is read as 100, and the line says so. Sierra Chart's own
Market Depth window (File > Open Market Depth Window) also lists the levels, but
it is a trading window: a click in it can place an order. The indicator starts
reading the order book with the first Time & Sales record, so trades must be
arriving for the instrument too.
Chart update interval. The indicator reads the order book each time Sierra
Chart updates the chart. We recommend 50 milliseconds: set Global Settings >
General Settings > Chart Update Interval in Milliseconds to 50, and on the chart
with the indicator set Chart > Chart Settings > Performance > Minimum Chart
Update Interval in Milliseconds For ACSIL UpdateAlways to 50. At slower intervals
more quick additions and cancellations happen between two reads and are missed.
The first line the indicator writes to the Message Log for each chart names the
interval that chart sees, for example
Pulling & Stacking Indicator 3.0.22 on BTCUSDT_PERP_BINANCE: Level Depth 10, book read every chart update (50 ms on this chart).
It is written when the chart loads, so after a restart of Sierra Chart it can sit
well above the lines Sierra Chart writes while it connects to the data feed:
scroll up to find it.
Activate your licence
The licence key is in the email you get when you subscribe, and starts with lic_.
Until it is active, the chart stays empty and the tile shows PAUSED with the
reason.
- Open the study's settings: choose Analysis > Studies (or press F6), select Pulling & Stacking Indicator in the list of studies on the chart and click Settings.
- Scroll the Settings and Inputs list down to Licence Key, near the end, and click that row. The list itself cannot be typed into: paste the key into the box that appears under the list.
- Click the Activate Licence row, choose Yes in the box under the list, and click Apply.
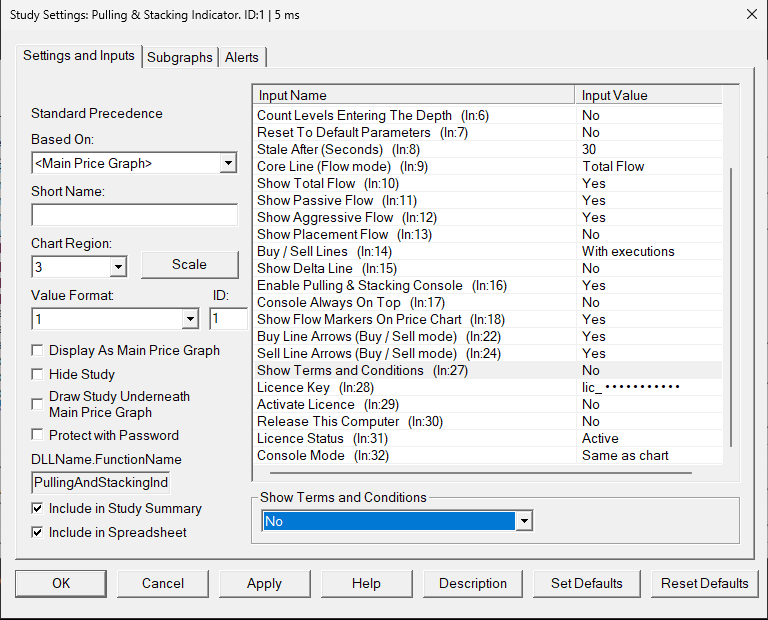
What you see afterwards:
- Sierra Chart waits a few seconds (at most about 4) for the licence to answer.
Then Licence Status reads
Active, Activate Licence is back at No, and Licence Key shows only the start of your key followed by dots, for examplelic_XXXX••••••••. If the licence has not answered yet, Licence Status readsChecking...and Licence Key still shows the key as you typed it: close the Chart Studies window and open the settings again a moment later to see the result. - The console's Global notifications say
Licence active on this computer., the tile leavesPAUSEDand the lines start. - Sierra Chart's Message Log (Window > Message Log) has the line
Pulling & Stacking: LICENCE: Licence active on this computer.Each licence change writes one such line.
Licence Status holds the state in a few words, so it fits the list:
Active, Active, reconnecting, Checking..., Required, Released,
Key not found, Subscription ended, Licence not active, In use elsewhere,
Offline, Check date and time, Release failed, No key entered, Error or
Nothing done. The whole message is in the console's Global notifications, in the
Message Log, and at the start of the input's description. Licence Status is a
list with a single entry, so it cannot be typed into.
Licence Key shows the key masked only while the licence is active on this computer, so dots always mean "this key works here".
- A key that was not accepted stays in the box as you typed it, so you can check
and correct it, and Licence Status says why (for example
Key not found). - A key you apply without setting Activate Licence to Yes is taken out of the box at that Apply, and the box shows the key in use again (or stays empty). The key you typed is kept until Sierra Chart closes: set Activate Licence to Yes and click Apply to send it.
- Setting Activate Licence to Yes with the masked key in the box checks the stored key again.
- If Activate Licence and Release This Computer are both Yes in one Apply,
neither is done and Licence Status reads
Nothing done. Set only one of them.
While the Chart Studies window stays open, a later change of the licence shows in Licence Status only after you close and reopen it. The key is kept for this computer, not in the chart or the chartbook, and the chart's study line does not print the inputs (Sierra Chart's Display Input Values is off for this study). One key covers one computer, whichever of our supported platforms you use on it.
The indicator needs an internet connection: it runs only while the licence
server confirms your licence, and there is no offline period. Without a
connection it pauses, also when Sierra Chart starts without one: the tile shows
PAUSED - could not reach the licence server, Licence Status reads Offline, and
Global notifications say
Could not reach the licence server. Check your internet connection. The indicator starts again once it connects.
It tries again every 30 seconds at first, then every 5 minutes, and starts again
by itself once it connects, carrying on with the warm-up it had (after a pause of
more than about 50 minutes, the warm-up starts again). If the connection drops
for a moment while the indicator is running, it goes on for up to 2 minutes while
it tries again: Licence Status reads Active, reconnecting and Global
notifications say
Licence active. Could not reach the licence server, trying again. The indicator pauses if it cannot connect within 2 minutes.
If the key is wrong, Licence Status reads Key not found and Global notifications
say We could not find that licence key. Check it and try again. The console tile
shows PAUSED - licence not active (see the study settings).
Release this computer
To move your licence to another computer, release it on this one first: open the
study's settings, set Release This Computer to Yes and click Apply.
Global notifications then say
This computer has been released from your licence. Enter your licence key again to use the indicator here.,
the tile shows PAUSED - licence required (see the study settings), and the
indicator stops here. Sierra Chart waits a few seconds for the answer; then
Release This Computer is back at No, Licence Key is empty, Licence
Status reads Released, and the console and the Message Log say that this
computer has been released. After Sierra Chart restarts, no key is stored on this
computer, so Licence Status reads Required.
Activate your key on the new computer. If the tile says
PAUSED - licence in use on another computer, release it there first, then set
Activate Licence to Yes again here. If you can no longer reach the old
computer, write to contact@stacksignal.com.
The console
The console is one window for all your charts. Each symbol the indicator is loaded on gets a tile with its headline, the 2, 3, 5 and 10 minute badges, a state line and a log. Alerts are set in the console: the bell on a tile for that symbol, and Global notification settings (top right) for every symbol. See the console and notifications. Every line of a tile's log is also written to Sierra Chart's Message Log.
Closing and reopening the console. Closing the console window with its close
box (X) hides it, and within a moment Enable Pulling & Stacking Console changes
to No on every chart that has the indicator. The console stays closed, also after
a restart of Sierra Chart (the input stays at No), and a chart you add while it is
closed shows No too. To reopen it, open the study's settings on any chart, set
Enable Pulling & Stacking Console to Yes and click Apply: the console opens
and the other charts change back to Yes. Setting it to No on any one chart closes
the console everywhere, and the other charts show No as well. So the input shows
whether the console is open: Yes on every chart while it is open, No on every
chart while it is closed. One exception comes from Sierra Chart: a Study Settings
window that was already open when the console was closed (or opened) keeps the
value it showed when you opened it. Its OK or Apply then does not change
the console, the input goes back to the console's state, and the Message Log says
a settings window opened before the console changed was closed with OK; its old console values were not applied.
To change it, open the settings again.
Always on top. Set Console Always On Top to Yes and click Apply to keep the console above other windows. While Sierra Chart shows one of its own dialogs (Chart Studies, Study Settings, or a question such as Save all? on exit), the console goes behind that dialog, also when you turn it on from an open Study Settings window, and it is on top again when the dialog closes. If you click the console while a dialog is open, it comes forward until you go back to the dialog. When you first turn on the console (Enable Pulling & Stacking Console and Console Always On Top both Yes) and click Apply while the Study Settings window is still open, the console may stay behind Sierra Chart until you click OK. It then comes to the front about a second after the settings windows close. Once the console is open, opening and closing settings windows places it correctly. It is one setting for the one console: the other charts with the indicator then show Yes too, a chart you add later takes the console's value, and setting it to No on any chart turns it off everywhere. A Chart Studies window that was already open on another chart still shows the old value; its OK does not change the setting back (the Message Log says so). Reopen it to change it there.
What the alert controls show. As on Bookmap, the bell looks the same whether or not any band is enabled for that symbol, so it does not tell you whether alerts are armed: click it to see which bands are on and their thresholds. Save closes the dialog and keeps the choices (saving a threshold arms that band again, so it can alert on its next crossing), and Cancel discards them. Nothing on the console shows whether the global alerts are on: open Global notification settings to check. An alert that fires is written to the tile's log, or to Global notifications, so the logs show what has alerted.
Sierra Chart's Alerts tab. The study's settings window also has Sierra Chart's own Alerts tab, which may show Enabled ticked with no condition. That tab is Sierra Chart's, not ours. Its Enabled tick does not mean the indicator's alerts are on, and nothing set there makes the indicator alert: its alerts are set only in the console, with the bell and Global notification settings.
Where your settings live
- The study's inputs (Primary Window, Line Mode, Console Mode, the band settings, lines and arrows) are saved with the chart in your chartbook. Save the chartbook (File > Save) to keep them.
- The console's settings (the alert thresholds, global notifications, sound,
text size, the window's place and size, and whether you closed it) are saved
for your Windows user in
%LOCALAPPDATA%\StackSignal\PullingAndStacking, and come back the next time Sierra Chart starts. - The licence, and your acceptance of the terms, are kept for this computer in the same folder.
Every input is described in the Sierra Chart settings reference.
Platform notes
- Updating: outside your trading hours, replace the file and restart Sierra Chart (File > Save All, File > Exit, start it again). Your chartbook, console settings and licence are kept. Replacing it without a restart also works: Analysis > Build Custom Studies DLL, Build > Release All DLLs and Deny Load (which unloads every custom study on every chart), wait a few seconds, replace the file, then Build > Allow Load DLLs. Windows may still hold the file for a moment after Release All DLLs: if the copy says the file is in use, wait a few seconds and try again. Restart is still the recommended way. If the console then does not stay on top with Console Always On Top set to Yes, restart Sierra Chart.
- Changing a setting with Apply keeps the flow engine running, so most changes keep the warm-up. Changing Level Depth or Count Levels Entering The Depth starts it again, and changing the S/R Lookback Multiplier or Buy / Sell Lines warms the bands again over their lookback.
- When the warm-up starts again (a Level Depth change, Reset To Default Parameters, the end of a Chart Replay, a feed reset), the bars already drawn keep their lines and band. The bar in which it starts again is left blank, and so are the bars until the new readings start, so no line joins the old readings to the new ones. The new lines then start in grey at 0 and step up to their readings once the first window has been seen; the band also starts from 0 when it first shows, so the first provisional band is drawn rising from the zero line over one bar (a steep line, not a spike in the flow).
- Reset To Default Parameters: set it to Yes and click Apply. When you open the settings again, the inputs it covers (listed in the settings reference) show their defaults and Reset To Default Parameters is back at No. If the reset changes Level Depth or Count Levels Entering The Depth, the warm-up starts again.
- A Buy / Sell band (a chart in Buy / Sell mode, or Console Mode Buy / Sell on a Flow chart) starts when you choose it and warms over the full lookback (10 minutes at a 2-minute window, 25 minutes at the default 5) before its readings are fully seeded.
- Removing it: remove the study from the chart (Analysis > Studies, select
it, Remove); its arrows and its console tile go with it. To remove it
completely, use Release All DLLs and Deny Load, delete
PullingAndStackingIndicator_64.dllfrom theDatafolder, then Allow Load DLLs.
Next: the flow decomposition · Sierra Chart settings reference · the console
Chart images. The chart images on this site show the indicator's display on market data, to explain what it draws. They are not trading results or trade recommendations, and the risk and hypothetical performance disclosures above apply to them. We publish no trading performance. The full text is on the disclosures page.