Sierra Chart settings reference
Open the study's settings with Analysis > Studies (or F6): select Pulling & Stacking Indicator in the list of studies on the chart and click Settings. The inputs are on the Settings and Inputs tab. The Description button opens a page in your web browser that describes every input. Changes take effect when you click Apply, or when you close the Chart Studies window with OK. OK in the Study Settings window alone does not apply a change: the chart shows it only once Chart Studies is closed with OK too. So click Apply to see a change at once. To edit a value, click its row in the list and change it in the box that appears under the list (the list itself cannot be typed into). The flow engine keeps running, so most changes keep the warm-up; changing Level Depth or Count Levels Entering The Depth starts it again, and changing the S/R Lookback Multiplier or Buy / Sell Lines warms the bands again over their lookback.
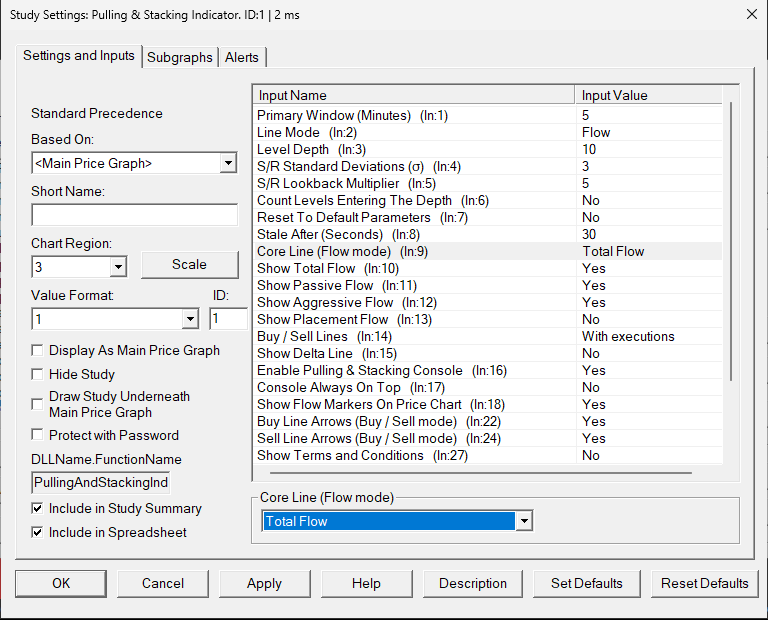
Settings and Inputs
| Input | Meaning | Default |
|---|---|---|
| Primary Window (Minutes) | Which window (2, 3, 5 or 10 minutes) drives the lines, the band and the alerts. The console ladder always shows all four. Bars drawn before a change keep the readings of the window they were drawn with. | 5 |
| Line Mode | Which family of lines the chart plots: Flow or Buy / Sell. See line modes. | Flow |
| Level Depth | How many bid and ask price levels are measured, for every line and the console (1 to 100; a larger value is read as 100). Changing it starts the warm-up again, and the Message Log gets one line with the new value (saying so when it was read as 100) and the depth levels the feed gives per side at that moment. It also affects how often the deep-book warning appears. | 10 |
| S/R Standard Deviations (σ) | Width of every Resistance / Support band in standard deviations of the line over the lookback (1 to 10). Applies from the next bar. | 3 |
| S/R Lookback Multiplier | Lookback of every band, and of the warm-up, as a multiple of each window (1 to 20). Changing it warms the bands again. | 5 |
| Count Levels Entering The Depth | No: a level that moves into the top Level Depth levels adds only its change in size. Yes: its full size counts as newly stacked each time price brings it into range, which gives larger, more price-driven readings. Changing it starts the warm-up again. It also affects how often the deep-book warning appears. | No |
| Reset To Default Parameters | Set to Yes and click Apply to restore Primary Window 5, Line Mode Flow, Console Mode Same as chart, Core Line Total Flow, the default lines (Placement Flow hidden), Buy / Sell Lines With executions, Show Delta Line No, Level Depth 10, S/R Standard Deviations 3, S/R Lookback Multiplier 5 and Count Levels Entering The Depth No. Stale After, the console, the arrow and the licence inputs are not changed. The input's own description (the Description button) gives the same list. When you open the settings again the inputs show their defaults and this input is back at No. If the reset changes Level Depth or Count Levels Entering The Depth, the warm-up starts again. | No |
| Stale After (Seconds) | With no trade and no order book change for this long (1 to 600), the lines turn grey and the tile shows STALE. It is also how long trades may arrive with no order book change before the tile shows ! ORDER BOOK DATA STOPPED. |
30 |
| Core Line (Flow mode) | The line you trade from: Total, Passive or Placement Flow. The band, the arrows and the console follow it; the band is redrawn over the kept history. Choosing a line that is hidden shows it: its Show input turns to Yes in the same Apply. See Placement Flow & the core line. | Total Flow |
| Show Total / Passive / Aggressive / Placement Flow | Which Flow lines are drawn in Flow mode. The input keeps the value you set; it turns to No by itself when you set the line's Draw Style to Ignore on the Subgraphs tab, and to Yes when you choose that line as the core line. In Buy / Sell mode the Flow lines are not drawn whatever these inputs say: they keep their values for when you go back to Flow. A hidden line keeps its history. Hiding the core line hides its band and arrows too, while the console and the alerts still read it. | Yes, Yes, Yes, No |
| Buy / Sell Lines | Buy / Sell mode: With executions or Placement only. See buy & sell lines. | With executions |
| Show Delta Line | Buy / Sell mode: draws Buy minus Sell, in white, with no band. Turns to No by itself when you set the Delta Line's Draw Style to Ignore. | No |
| Enable Pulling & Stacking Console | Shows the shared console. Set to No to hide it. Closing the console with its close box (X) sets this to No on every chart; set it to Yes and click Apply on any chart to open the console again, and the other charts go back to Yes. So it reads Yes on every chart while the console is open and No while it is closed. A settings window that was already open when the console closed (or opened) keeps the old value; its OK does not change the console, and the input goes back to the console's state. In the box under the list, Sierra Chart drops the & from the name (Enable Pulling Stacking Console). Alert settings live inside the console. |
Yes |
| Console Always On Top | Keeps the console above other windows, except Sierra Chart's own dialogs: while one is open (Chart Studies, Study Settings, a question such as Save all?) the console goes behind it, also when you turn this on from an open Study Settings window, and it is on top again when the dialog closes. When you first turn on the console with Apply while the Study Settings window is open, it may stay behind Sierra Chart until you click OK; it then comes to the front. One setting for the one console: changing it on one chart and clicking Apply changes it on every chart, so every chart shows the same value; a chart added later takes the console's value. A settings window that was already open keeps the old value, and its OK does not change the setting back. | No |
| Show Flow Markers On Price Chart | Master switch for the arrows on the price chart. | Yes |
| Buy Line Arrows / Sell Line Arrows (Buy / Sell mode) | Which of the two lines draw arrows. | Yes, Yes |
| Show Terms and Conditions | Set to Yes and click Apply to read the terms again. Once you have accepted them, the window says, for example, You accepted these terms on 28 October 2026. and has a single Close button. The input goes back to No by itself. |
No |
| Licence Key | Click the row and paste your key into the box under the list, then use Activate Licence. While the licence is active on this computer it shows only the start of the key followed by dots, for example lic_XXXX••••••••; Activate Licence with that masked text checks the stored key again. A key that was not accepted stays as you typed it, so you can correct it. A key applied without Activate Licence is taken out of the box at that Apply and kept until Sierra Chart closes; Activate Licence then sends it. |
|
| Activate Licence | Set to Yes and click Apply to activate the key on this computer. It goes back to No by itself; Licence Status and Global notifications show the result. With Release This Computer also Yes in the same Apply, neither is done (Licence Status: Nothing done). |
No |
| Release This Computer | Set to Yes and click Apply to stop using your licence here, so you can activate it on another computer. It goes back to No by itself. | No |
| Licence Status | The licence state in a few words: Active, Active, reconnecting, Checking..., Required, Released, Key not found, Subscription ended, Licence not active, In use elsewhere, Offline, Check date and time, Release failed, No key entered, Error or Nothing done. Written when you Apply Activate Licence or Release This Computer (Sierra Chart waits up to a few seconds for the answer; Checking... if it has not come yet). A later change shows after you close and reopen the Chart Studies window. It is a list with a single entry, so it cannot be typed into. The whole message is in Global notifications, the Message Log and at the start of the input's description. |
|
| Console Mode | What this symbol's console tile and its alerts read: Same as chart, Flow (the Core Line) or Buy / Sell. The chart's lines, band and arrows always follow Line Mode. A Buy / Sell console on a Flow chart warms its band over the full lookback (25 minutes at the defaults). See Console Mode. | Same as chart |
The three calibration inputs (Level Depth, S/R Standard Deviations and S/R Lookback Multiplier) change what counts as a strong reading. The defaults are a starting point; see calibrating the parameters.
Subgraphs
Colours and widths are on the Subgraphs tab, which always lists all fifteen subgraphs; the ones outside the current Line Mode draw nothing.
| Mode | Subgraphs | Default colours |
|---|---|---|
| Flow | Total Flow, Passive Flow, Aggressive Flow, Flow Resistance, Flow Support, Placement Flow | Cyan (2 px wide), grey, orange, light grey (dotted), light grey (dotted), violet |
| Buy / Sell | Buy Line, Sell Line, Buy/Sell Resistance, Buy/Sell Support, Delta Line | Green, red, light grey (dotted), light grey (dotted), white |
Each band also has a "(provisional)" subgraph, for the bars where it is still warming up: a provisional band is drawn in that subgraph's colour, width and line style (grey, 1 px, dashed by default). The band's own subgraph applies once it is fully seeded, drawn dotted. The zero line before a band shows, and a stale bar, stay grey, the same grey as a line that is warming up or stale. Each bar keeps the style it was drawn in. Passive Flow's default colour is that same grey, so give it another colour if you want to tell it apart from a line that is warming up. A Draw Style you set is kept. Set to Ignore, a line is hidden: for a line with a Show input that input turns to No (set it to Yes to draw the line again); a band or the Buy or Sell line stays hidden until you set its Draw Style back, or until the indicator hides and shows it itself (for example when Line Mode changes). Arrow colours are fixed: green up is bullish, red down is bearish.
A new study draws in its own panel: when it starts, it moves out of a Chart Region another study already uses (Sierra Chart may add it in Chart Region 2, the Volume panel) to the first unused one, usually Chart Region 3. It does this only once, so a region you choose later in Chart Region is kept. Sierra Chart's Display Input Values is off for this study, so the chart's study line does not print the inputs (the Licence Key box among them).
A study you added with an earlier version gets these styles (dotted bands, dashed grey provisional bands) once, the first time this version loads it; a "(provisional)" subgraph keeps a colour you had given it, unless that is its band's colour. After that your own style changes are kept.
Alerts
Alert thresholds are set in the console, not in the study's settings: the bell on the symbol's tile, and Global notification settings. See notifications. The default global threshold is 3σ. The study's settings window also has Sierra Chart's own Alerts tab, which may show Enabled ticked with no condition. That tab is Sierra Chart's, not ours: its Enabled tick does not mean the indicator's alerts are on, and nothing set there makes the indicator alert.
Chart images. The chart images on this site show the indicator's display on market data, to explain what it draws. They are not trading results or trade recommendations, and the risk and hypothetical performance disclosures above apply to them. We publish no trading performance. The full text is on the disclosures page.