Support & Resistance
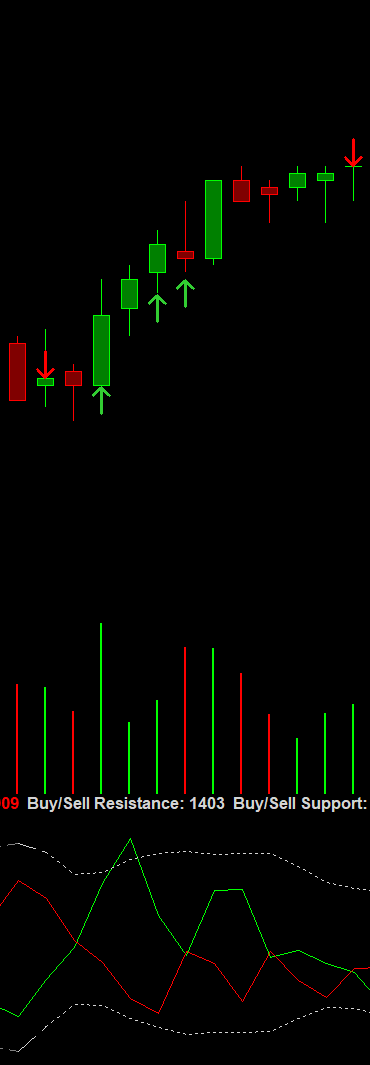
The ±3σ band of the line you trade from, the core line (Total Flow unless you change it), is drawn on the flow panel as two dotted lines:
- Flow Resistance, the upper band (+3σ)
- Flow Support, the lower band (−3σ)

Flow tagging the band is statistically stretched relative to the last 5×-window of its own behaviour, context you would otherwise have to carry in your head. The band is plotted as a dashed grey line at zero until two windows of data have been seen. From then on it is drawn as a provisional band, dashed, in the colour of its "(provisional)" subgraph (grey by default), until its full lookback is seeded, and from that point it is drawn dotted, in its own colour (light grey by default). Each bar keeps the style it was drawn in; see indicator states.
Bands are context, not trade calls. An arrow on the price chart marks where the line you read crossed outside its band; it is not an instruction to buy or sell, and it is not a prediction. See price-chart markers.
Whose band it is
There is one band pair in Flow mode, and it always belongs to one line: the core line. It is sized from that line's own variability, so a 3σ cross means the same thing whichever line you choose. A band is never borrowed from another line and is never drawn for a line you have hidden.
Resistance / Support in the other line modes
The Buy / Sell line mode draws its own Resistance and Support lines around the two plotted lines: their mean over the lookback, plus and minus the same number of standard deviations. Resistance and Support lines are always drawn; there is no option to switch them off.
Calibrating the parameters
Three settings shape every line, every band, the σ readout and the alerts:
| Setting | Meaning | Default | Range |
|---|---|---|---|
| Level Depth | How many bid and ask price levels pulling and stacking is measured across. | 10 | 1 to 100 |
| S/R Standard Deviations (σ) | Width of every Resistance / Support band, in standard deviations of the line over the lookback. | 3 | 1 to 10 |
| S/R Lookback Multiplier | Lookback of every band, and of the warm-up, as a multiple of each flow window. 5 × the 5-minute window looks back 25 minutes. | 5 | 1 to 20 |
These parameters can be changed, but changing them changes what counts as a strong reading. The defaults are a starting point, not a recommendation for your market. Instruments differ in pace and book depth, so adjust the depth and band settings to suit the market you trade. If you change them, calibrate: watch how the σ readout and the band behave on your instrument before relying on the new values. To restore the defaults, set Reset To Default Parameters to Yes and click Apply. When you open the settings again, the inputs show their defaults and Reset To Default Parameters is back at No.
Changing the lookback multiplier empties the bands, so they warm up again over the new lookback. Changing the standard deviations applies from the next bar; bars already drawn keep the band they had.
Next: Placement Flow & the core line
Chart images. The chart images on this site show the indicator's display on market data, to explain what it draws. They are not trading results or trade recommendations, and the risk and hypothetical performance disclosures above apply to them. We publish no trading performance. The full text is on the disclosures page.