Indicator states
The indicator does not present dead or unseeded output as signal. This is state display, not data filtering: the engine keeps reading the raw stream, and the display says what state the data is in.
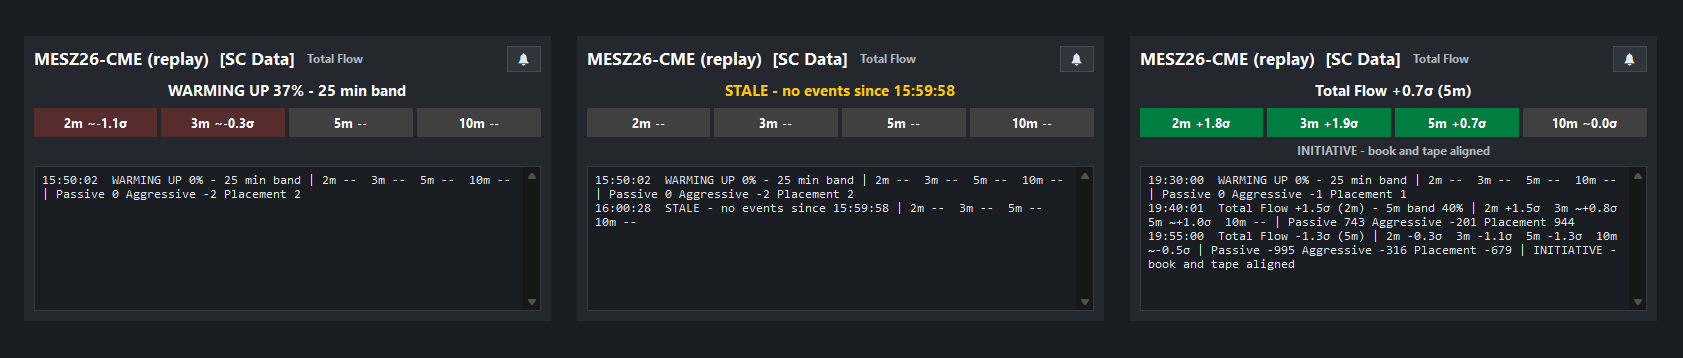
Warming up
The indicator comes up in stages, so you are not left waiting on a blank panel. With the default settings (5-minute primary window, 5× lookback):
| After | What you get |
|---|---|
| 5 min (one window) | The flow lines. Total, Passive and Aggressive Flow are exact once one full window has been seen. |
| 10 min | A fully seeded 2-minute reading in the headline, e.g. Total Flow +1.9σ (2m) - 5m band 40%, and a provisional band on the chart. |
| 15 min | The 3-minute reading takes over the headline. |
| 25 min | The primary band is fully seeded: Total Flow +4.2σ (5m). Alerts can fire. |
| 50 min | The 10-minute ladder cell is live. |
Provisional readings are estimates. Until a band has its full lookback it
rests on few independent samples and tends to be too narrow, so early σ values
read high. They are marked so you can tell: a ~ before the value
(5m ~+2.1σ), a muted badge colour in the console, and a dashed band on the
chart (grey by default; its colour is the band's "(provisional)" subgraph on the
Subgraphs tab), which is drawn dotted in its own colour once it is fully seeded.
The panel stays blank until the first trade or order book change arrives after
the study starts (or after its warm-up starts again). From then until one full
window has been seen the lines are drawn grey, at zero, and they then step up to
their readings. The first provisional band is drawn rising from the zero line over
one bar. The chart itself does not
say WARMING UP: until the band shows, the chart's study line reads 0 for Flow
Resistance and Flow Support, so read the state on the console tile.
Provisional readings never trigger alerts.
Before the first stage the console shows progress:
WARMING UP 12% - 25 min band. Each window warms independently, so the
ladder fills in from left to right.
Ways to shorten the wait
- The indicator warms from live data. The order book and the Time & Sales already on the chart when the study starts are not counted as flow, and bars from before it started stay blank, also the recent bars Sierra Chart fills in from its server after the study started. A second chart of the same symbol warms up on its own.
- Leave the platform running. The indicator loads with the platform and warms while you do something else.
- Most setting changes do not restart the warm-up. Clicking Apply keeps the flow engine running. It starts over if Level Depth or Count Levels Entering The Depth changes, if the chart's symbol changes, if the study is removed and added again, when a Chart Replay starts, jumps back or ends, or if the feed's clock jumps back by more than 5 seconds or forward by more than 50 minutes. Changing the S/R Lookback Multiplier re-warms the bands over the new lookback, and changing Buy / Sell Lines re-warms the Buy / Sell band, without touching the flow lines. After a restart the bars already drawn keep their lines and band; the bar in which it starts again, and the bars until the new readings start, stay blank, so no line joins the old readings to the new ones. A Level Depth or Count Levels Entering The Depth change writes one line to the Message Log with the new values and the depth levels the feed gives at that moment.
- A shorter Primary Window or S/R Lookback Multiplier warms faster, but changes what the readings mean; see calibrating the parameters.
Stale
A data stream that stops without notice can look like "flow went quiet", which reads as information when it is an outage. If no events arrive for the configured number of seconds (default 30):
- the chart lines and bands are drawn grey,
- the tile headline turns orange:
STALE - no events since 09:41:07, - the ladder shows
--, - alerts are suppressed until events resume.
Waiting for order book data
WAITING FOR ORDER BOOK DATA means the instrument has not delivered a single
trade or order book change yet: no depth or Time & Sales data, or a market that
has not opened. The indicator starts reading the order book with the first Time &
Sales record, so a feed that sends depth but no Time & Sales stays in this state.
- After 15 seconds without order book data, the tile's state line adds
No Level II depth received. - After 60 seconds with no market data at all, it reads
No market data received. Check the data connection, and that the instrument is trading.
Order book data stopped
If trades keep arriving but the order book has not changed for the stale timeout
(30 seconds by default), the tile shows, in orange,
! ORDER BOOK DATA STOPPED - trades are arriving but the book is not updating, so Passive Flow is frozen. Check the Level II feed; alerts are paused.
The lines are drawn grey, and alerts and arrows pause until the order book
updates again. The tile's readings keep their colours meanwhile; only their
Aggressive Flow part still moves, so read them as frozen until the warning
clears. The stale timeout is the Stale After (Seconds) input: set very low, a
healthy feed whose top levels sit still for a moment raises this warning.
Check your market depth subscription and Sierra Chart's
Max Depth Levels (see getting started).
Paused
PAUSED means the indicator is not producing output on this computer, and the
chart stays empty. The study's name on the chart reads
Pulling & Stacking Indicator - PAUSED meanwhile, so the chart shows it too.
The text after it says why:
| Tile shows | What to do |
|---|---|
PAUSED - licence required (see the study settings) |
Enter your licence key and activate it (see activating your licence). |
PAUSED - checking your licence |
Wait a few seconds while the licence answers. |
PAUSED - licence in use on another computer |
Release it on the other computer, then set Activate Licence to Yes again here. |
PAUSED - could not reach the licence server |
Check your internet connection: the indicator runs only while it can confirm the licence online, and starts again once it connects. |
PAUSED - licence not active (see the study settings) |
Licence Status says why; activate again, or write to contact@stacksignal.com. |
licence required shows when no key is stored on this computer, also after
Release This Computer; licence not active when a key was not accepted (not
found, the subscription ended, or the licence is no longer active). The same
message, in full, is in Global notifications and in Sierra Chart's Message Log.
The bars of the paused minutes stay blank, and so does the bar in which output
starts again, so the lines are not joined across the pause.
Replay
On Chart Replay at 1x or 2x the indicator reads the replay the way it
reads live data, on the replay's own time: the 2, 3, 5 and 10 minute windows, the
warm-up, the bands, the alerts and the arrows all run on market time. A paused
replay stops that clock, so the tile does not go STALE while it is paused. When
the replayed market goes quiet (no data for Stale After seconds of market
time), the tile shows STALE - no events since <time> with the replay's time of
the last event. The
replay gets its own tile in the console, named after the instrument with
(replay) (for example BTCUSDT_PERP_BINANCE (replay)), which starts with the
instrument's alert settings, and it starts its own warm-up (see
warming up) from where the replay starts. The bars before the replay's start keep the
lines drawn on live data; the replay's bars show the replay's readings. A jump
back in the replay starts the warm-up again from there. When the chart is back on
live data, the replay's lines, arrows and tile go, the live lines come back, and
the indicator starts its warm-up again.
Passive Flow and the deep-book readings need market depth data recorded for the
day being played: Sierra Chart replays the order book only for the times it has
recorded depth for. Without it Passive Flow stays near 0 and the tile shows
WAITING FOR ORDER BOOK DATA, or says the order book data stopped where the
recorded depth ends.
REPLAY - set the replay speed to 2x or slower means the replay runs faster than
2x. Sierra Chart moves the replayed order book once per chart update, so a faster
replay shows the indicator only part of the book's changes and Passive Flow would
not match what live data gives. The indicator pauses: the tile shows this line
with grey badges, the indicator draws, marks and alerts nothing, and the study's
name on the chart ends in - REPLAY. Set the speed back to 2x or slower and it
starts its warm-up again. Sierra Chart's Message Log gets one line when the
replay starts or changes speed, and one when it stops.
Next: notifications
Chart images. The chart images on this site show the indicator's display on market data, to explain what it draws. They are not trading results or trade recommendations, and the risk and hypothetical performance disclosures above apply to them. We publish no trading performance. The full text is on the disclosures page.