The Pulling & Stacking Console
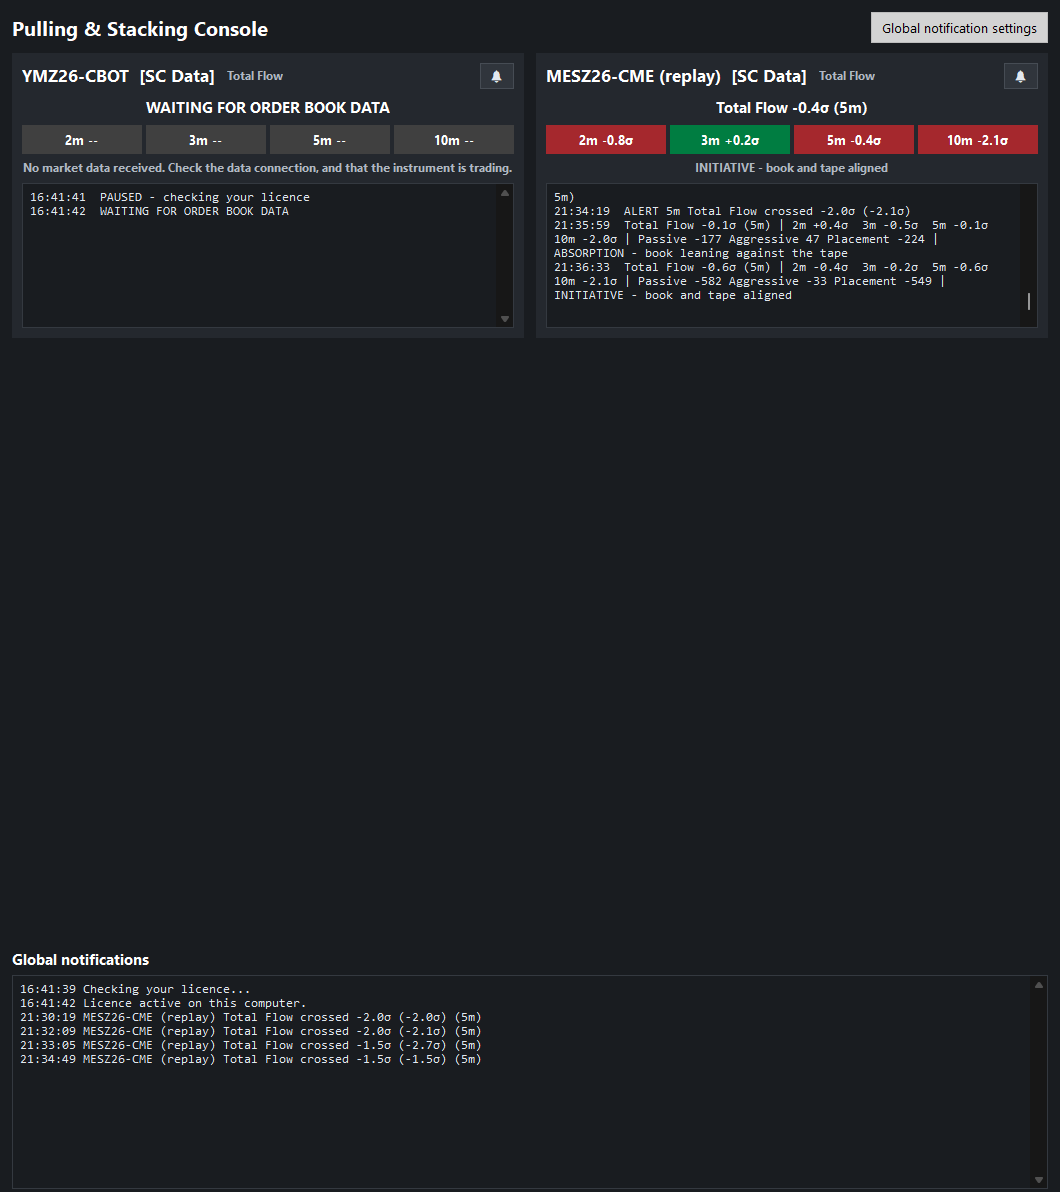
The Pulling & Stacking Console is one window that shows every instrument the indicator is running on. Each instrument gets a tile with its live readout, the four-window σ ladder, and a scrolling log. Alerts for all instruments collect in a Global notifications log at the bottom of the same window.
The detailed readout lives in the console instead of being stamped over the chart,
so the flow lines on the chart stay clean. On Sierra Chart the console is a window
of its own, outside the chart windows, titled
Pulling & Stacking Console (Sierra Chart). Windows groups it under Sierra
Chart's taskbar icon: point at that icon to see the console's thumbnail and click
it. The heading inside the window is the same as on the other platforms, so if you
also run the indicator on another platform, the title bar tells you which console
is which. It opens once the terms are accepted.
What a ticker tile shows
Each tile has, from top to bottom:
- Instrument name and the feed it is subscribed through, the line the
tile reads (for example
Total Flow,Placement FloworBuy / Sell), and a bell button for that instrument's alerts. Every reading on the tile is about that line. It is the line the chart is set to unless Console Mode chooses the other family; then the chart's line is named too:Total Flow (chart: Buy / Sell). - Headline. One of:
Total Flow +4.2σ (5m): the live reading on the primary window. On a chart set to another core line the headline names it:Passive Flow -3.6σ (5m).Buy Line +3.5σ · Sell Line -1.0σ (5m): a tile reading Buy / Sell: both lines, each measured from the centre of their shared band.Total Flow +1.9σ (2m) - 5m band 40%: the primary band is still seeding, so the headline shows the longest window that is fully seeded.Total Flow ~+2.1σ (5m) - warming 40%: a provisional estimate (note the~).WARMING UP 12% - 25 min band: nothing is seeded yet.STALE - no events since 09:41:07(orange): no market events have arrived for longer than the stale timeout.WAITING FOR ORDER BOOK DATA: the instrument has not sent a trade or an order book change yet (see indicator states).PAUSED - licence required (see the study settings),PAUSED - checking your licence,PAUSED - licence in use on another computer,PAUSED - could not reach the licence serverorPAUSED - licence not active (see the study settings): the licence is not active on this computer, so the chart stays empty (see activating your licence).licence requiredshows when no key is stored here (also after Release This Computer),licence not activewhen the key was not accepted (not found, the subscription ended, or the licence is no longer active), andchecking your licencewhile an activation waits for its answer.- The σ ladder. Four badges for the 2, 3, 5, and 10 minute windows, for the
tile's line. In Buy / Sell mode each badge shows whichever line is further
from the band's centre, named:
5m Buy +3.5σ. A badge is green when the reading on that window is bullish (buy orders stacked or sell orders pulled) and red when it is bearish (sell orders stacked or buy orders pulled). In Flow mode that means a positive reading is green and a negative one red. In Buy / Sell mode,Buy +2.6σis green andBuy -2.6σis red, whileSell +1.7σis red andSell -1.7σis green. A badge is grey with--while that window is warming up or the feed is stale. A muted badge with~is a provisional estimate (see indicator states). - State line when one applies:
! TOP OF BOOK FIGHTING THE DEEP BOOK(orange, the deep-book warning) orABSORPTION - book leaning against the tape/INITIATIVE - book and tape aligned(the book-vs-tape state). It can also say! ORDER BOOK DATA STOPPED - ...(orange: trades arrive but the order book does not update),No Level II depth receivedorNo market data received. ...; see indicator states. - A scrolling log. A line is added when the reading's status changes
(waiting for data, warming up, provisional, live, stale, paused), and, while
the reading is live, when the state line changes and the new state has held
for 10 seconds; a new
PAUSEDreason is added once it has held for 10 seconds too. The no-data hints (No Level II depth received,No market data received. ...) show on the state line only; the log keeps itsWAITING FOR ORDER BOOK DATAline. A steady reading adds no lines. Each line carries the full reading at that moment:
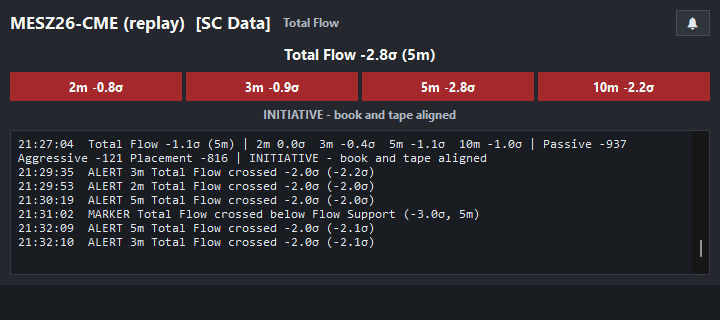
15:53:31 Total Flow +4.2σ (5m) | 2m +1.4σ 3m +2.5σ 5m +4.2σ 10m +4.0σ | Passive 2030 Aggressive 8 Placement 2022 | INITIATIVE - book and tape aligned
headline, ladder, the Passive, Aggressive and Placement components in
contracts, then the state. Alerts for that instrument's time bands appear in
the same log, naming the line: ALERT 5m Total Flow crossed +3.0σ (+3.4σ).
The log is bounded and scrolls automatically.
Every line in the tile logs and in Global notifications is stamped with this
computer's clock, so the times always run forward. When the data feed runs a
minute or more behind that clock (a delayed feed), the tile log says so once,
and again when the delay changes by a minute or more:
FEED - the data arrives about 10 minutes behind this computer's clock. Times in this log are this computer's.
A Chart Replay tile (<instrument> (replay)) is stamped with the replay's own
time instead, its STALE - no events since ... headline included, which names
the replay's time of the last event and stays put while the tile is stale.
While a chart replays, the Global notifications lines on this computer's clock
(the licence, the terms, the remote configuration) carry (computer clock)
after their time, as the replay's alert lines there are on the replay's time.
The tile is updated once a second, so a status that lasts less than that may
not get a line of its own. The status is the primary window's: a shorter
window's provisional ~ badge adds no line while the primary window is still
warming up, and neither does a Console Mode change that leaves the status
as it was.
Reading several instruments at once
Tiles arrange themselves in a grid that reflows as the window is resized. Each
window of each instrument warms up independently, so a newly added instrument shows
WARMING UP while the others are live.
- One tile per symbol, headed by the symbol and Sierra Chart's data service in
brackets, for example
BTCUSDT_PERP_BINANCE [SC Data]. - Several charts of the same symbol share one tile. The first chart that loaded the indicator decides what the tile reads (its Line Mode, Console Mode, Primary Window and Stale After). The other charts' settings still show their own values (Sierra Chart does not grey them out), and these take effect for the tile only when that chart takes it over. If the first chart's study is removed, the next chart takes over at once, with its own settings and alerts, without a line saying so; the log is kept, and the tile's earlier lines are not written to the Message Log again.
- The tile's
MARKERlines are that first chart's arrows. Arrows on the other charts are drawn on their own charts and go to Sierra Chart's Message Log, not to the tile, so every line on the tile reads against the same window and band. - Each chart runs its own flow engine, so each chart warms up on its own.
- Tiles appear in the order the instruments were added.
Price-chart markers
If your eyes are on price, not on the flow panel, the markers bring the signal
to where you are looking. An arrow is drawn on the price chart, and a MARKER
line is added to that instrument's log on its console tile, when the line your chart trades from crosses
outside its own Resistance or Support on the primary window. Arrows always
follow the chart's Line Mode, whatever the
Console Mode:
MARKER Total Flow crossed above Flow Resistance (+3.2σ, 5m)
MARKER Buy Line crossed above Buy/Sell Resistance (+3.1σ, 5m)
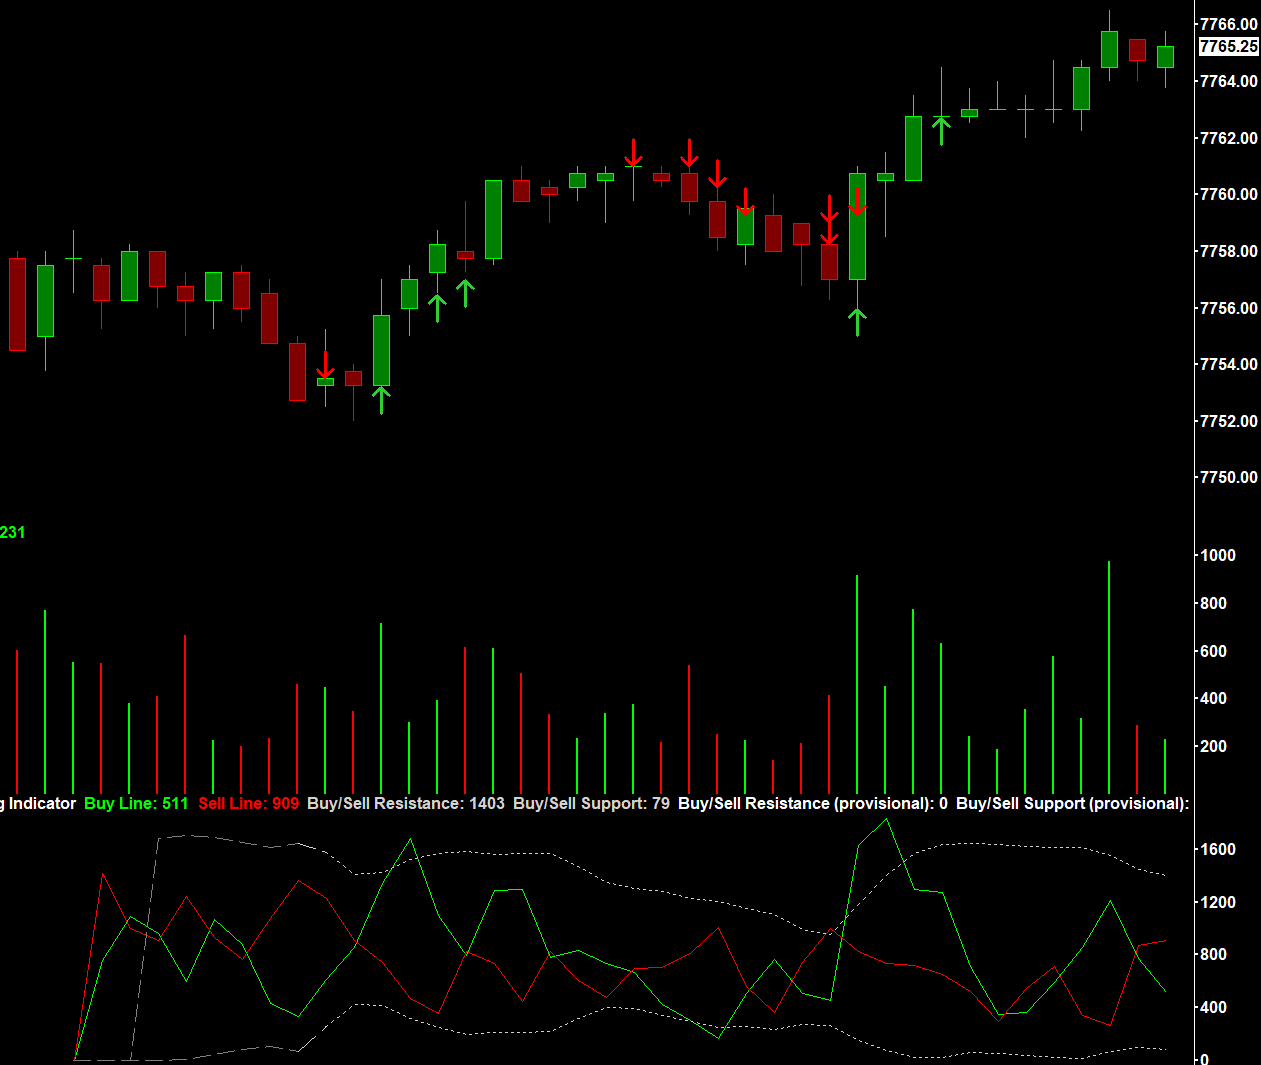
Green arrows below the bars mark bullish crossings and red arrows above them mark bearish ones; each sits on the bar where the Buy Line (green) or the Sell Line (red) in the panel below crossed outside its band. Shown with a 2-minute window and a 2σ band so that several crossings fit in one picture; at the defaults (5 minutes, 3σ) arrows are less frequent.
| Line mode | Lines that draw arrows | Against |
|---|---|---|
| Flow | The core line only (Total Flow by default) | Flow Resistance / Flow Support, sized from that line |
| Buy / Sell | Buy Line and Sell Line (each can be switched off) | Buy/Sell Resistance / Support of the pair on screen |
Every arrow quotes a σ figure, because every arrow is read against its own line's band. The arrow shows what the crossing means for the market, whichever line drew it:
- A green arrow pointing up, below the price, is bullish: buy orders stacked, or sell orders pulled, beyond the band. In Flow mode that is the core line crossing above Resistance.
- A red arrow pointing down, above the price, is bearish: sell orders stacked, or buy orders pulled, beyond the band. In Flow mode that is the core line crossing below Support.
So the Sell Line crossing above Resistance (sell orders stacked) draws a red arrow pointing down, and the Sell Line crossing below Support (sell orders pulled) draws a green arrow pointing up. The note in the console still names the line and the crossing. The arrow is drawn on the bar where the crossing happened: a bullish arrow 2 ticks below the bar's low, a bearish one 2 ticks above its high, and a Sell Line arrow 5 ticks out, so Buy and Sell arrows on the same bar stack outwards. Its price is set when it is drawn, so a bar that extends later may overlap it. The offsets are in ticks: on an instrument with a very small tick (bitcoin, for example) they are too small to see at a normal zoom, so the arrow sits on the bar's high or low and a Buy and a Sell arrow on the same bar overlap. On Sierra Chart the arrows are large and bold: Sierra Chart sizes them from the chart's bar spacing, so an arrow is about as wide as a candle and grows and shrinks as you zoom in and out.
A hidden core line draws no arrows, and a band is only ever read by the line it was sized from.
- A marker is a prompt to look at the flow panel or the console, not a signal to trade.
- It uses the band you set (S/R Standard Deviations), needs no alert to be switched on, and follows the same minimum interval as the alerts.
- Markers are drawn only when the band is fully warm and the feed is live.
- Show Flow Markers On Price Chart in the study's settings is the master switch. In Buy / Sell mode, Buy Line Arrows and Sell Line Arrows choose which lines draw them.
- The
MARKERline also goes to Sierra Chart's Message Log, asPulling & Stacking BTCUSDT_PERP_BINANCE: 15:53:31 MARKER .... - Each chart keeps at most 2,000 arrows; past that the oldest are removed. Arrows are kept when the chart is recalculated.
If you cannot hear the alerts
Open Global notification settings in the console and press Test sound.
- If it reports that the sound played but you hear nothing, the problem is the volume or the output device, not the indicator.
- The sound is a Windows notification sound from the Windows
Mediafolder. If it cannot play, the indicator uses the system beep and says why, next to the button (for exampleWindows audio failed (no Windows alert sound file found); system beep used.) and once in Global notifications. - Notification sound is off by default; alerts still appear as text.
Per-instrument alerts (the bell)
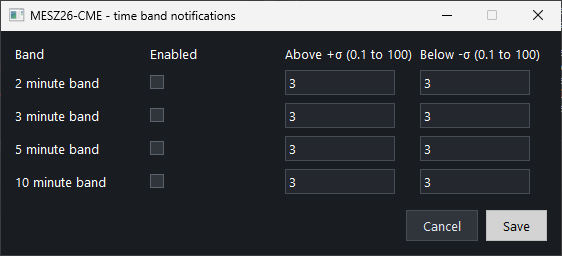
Click the bell on a tile to choose which time bands alert for that instrument, with separate thresholds for positive and negative readings of the tile's line: the line the console reads, which is the chart's line unless Console Mode says otherwise.
| Column | Meaning |
|---|---|
| Band | The 2, 3, 5, or 10 minute window. |
| Enabled | Whether this window alerts for this instrument. Off by default. |
| Above +σ | Alert when the tile's line on this window rises through this many standard deviations. Default 3. |
| Below −σ | Alert when the tile's line on this window falls through this many standard deviations. Default 3. |
When the tile reads Buy / Sell, the Buy Line and the Sell Line each alert on their own.
An alert fires when the reading crosses the threshold, and re-arms once the reading comes back inside it. Alerts never fire while a window is warming up or the feed is stale.
Save closes the dialog and keeps your choices; Cancel closes it and keeps the previous ones. The bell itself looks the same whether or not any band is enabled, so click it again to see which bands are on and their thresholds. An alert that fires is written to the tile's log.
Global notifications
The bottom section of the console is a single log shared by every instrument. Global alerts watch the line each tile reads, on the primary window (the core line for Flow, the Buy and Sell lines for Buy / Sell; by default the chart's line, see Console Mode) against one shared threshold, and are written as
15:53:34 BTC-USDT Total Flow crossed +3.0σ (+4.3σ) (5m)
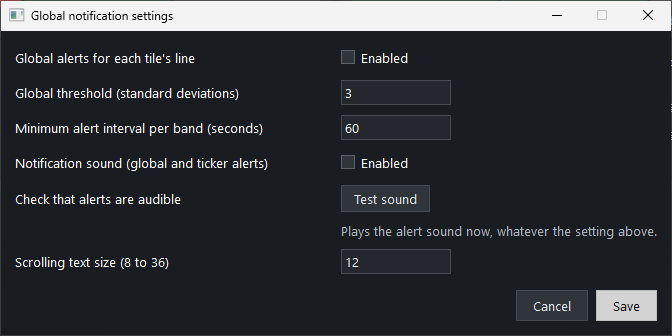
Click Global notification settings to change:
| Setting | Meaning | Default |
|---|---|---|
| Global alerts for each tile's line | Turns the shared alerts on or off. | Off |
| Global threshold (standard deviations) | The σ level that triggers a global alert. | 3 |
| Minimum alert interval per band (seconds) | Quiet period before the same band can alert again. Saving new thresholds re-arms the bands, so a band can alert at once on its new threshold. | 60 |
| Notification sound (global and ticker alerts) | Plays a sound for global and per-instrument alerts. Works while the console is hidden. | Off |
| Test sound | Plays the alert sound now, whatever the setting above, and says whether it played. Use it to check your volume and output device. | n/a |
| Scrolling text size (8 to 36) | Font size of the logs. | 12 |
Save closes the dialog and applies the settings; Cancel keeps the previous ones. A value outside its range is not saved: a message asks for a valid value and the dialog stays open. Nothing else on the console shows whether the global alerts are on, so open Global notification settings to check. A global alert that fires is written to the Global notifications log.
Opening, hiding, and closing
The console is enabled by default and opens when the indicator loads.
- Enable Pulling & Stacking Console in the study's settings shows or hides it. Setting it to No on any one chart and clicking Apply closes the console everywhere, and the other charts show No too.
- Closing the console window with its close box (X) hides it, and within a moment Enable Pulling & Stacking Console changes to No on every chart that has the indicator. The console stays closed, also after Sierra Chart restarts, and a chart added while it is closed shows No. To open it again, set Enable Pulling & Stacking Console to Yes on any chart and click Apply: the console opens and the other charts go back to Yes.
- A Study Settings window that was already open when the console was closed (or opened) keeps showing the value it had when you opened it. Its OK or Apply does not change the console: the input goes back to the console's state and the Message Log says the old values were not applied. Open the settings again to change it.
- Removing the indicator from the last chart closes the console; adding it again opens it.
The console does not stay above other windows unless you set Console Always On Top to Yes and click Apply. It is off by default. While Sierra Chart shows one of its own dialogs (Chart Studies, Study Settings, or a question such as Save all? on exit), the console goes behind that dialog, also when you turn the setting on from an open Study Settings window, and it is on top again when the dialog closes. If you click the console while a dialog is open, it comes forward until you go back to the dialog. When you first turn on the console (Enable Pulling & Stacking Console and Console Always On Top both Yes) and click Apply while the Study Settings window is still open, the console may stay behind Sierra Chart until you click OK. It then comes to the front about a second after the settings windows close. Once the console is open, opening and closing settings windows places it correctly. Without Always On Top, a Sierra Chart dialog that closes brings Sierra Chart's window back in front of the console; click the console's thumbnail under Sierra Chart's taskbar icon to bring it back. It is one setting for the one console: changing it on one chart changes it on every chart with the indicator, so every chart shows the same value, and a chart added later takes the console's value. A settings window that was already open on another chart keeps the old value, and its OK does not change the setting back.
Logs keep accumulating and sounds keep playing while the console is hidden. The console never places trades.
Next: indicator states
Chart images. The chart images on this site show the indicator's display on market data, to explain what it draws. They are not trading results or trade recommendations, and the risk and hypothetical performance disclosures above apply to them. We publish no trading performance. The full text is on the disclosures page.