MethodologyDocsPricingContactSign in
Get the indicator
MethodologyDocsPricingContactSign in
Get the indicator
Contents
Start here
Pulling & Stacking IndicatorGetting started on MotiveWave
Signals
Flow decompositionThe σ readoutThe window ladderSupport & ResistancePlacement Flow & the core lineLine modesBuy & sell linesThe deep-book warningAbsorption & initiative
Console & alerts
The Pulling & Stacking ConsoleIndicator statesNotifications
Settings reference
MotiveWave settings referenceLocal data APILimitations
Updates & legal
Updates & deprecationTerms, patents & legal
Start here
Pulling & Stacking IndicatorGetting started on MotiveWave
Signals
Flow decompositionThe σ readoutThe window ladderSupport & ResistancePlacement Flow & the core lineLine modesBuy & sell linesThe deep-book warningAbsorption & initiative
Console & alerts
The Pulling & Stacking ConsoleIndicator statesNotifications
Settings reference
MotiveWave settings referenceLocal data APILimitations
Updates & legal
Updates & deprecationTerms, patents & legal
Platform
BookmapMotiveWaveSierra Chart
Documentation · 3.0.22

Flow decomposition

Every order-book update the platform provides is decomposed exactly:

Line What it measures
Total Flow Passive book changes + aggressive executions. The headline signal.
Passive Flow Resting liquidity stacked (+) or pulled (−) across the nearest book levels.
Aggressive Flow Executed volume delta (buys − sells), the classic tape delta.
Placement Flow Passive Flow minus Aggressive Flow: orders placed and cancelled, with executions taken out. Hidden by default; see Placement Flow & the core line.

Total Flow = Passive + Aggressive, exactly, on every event. There are not two rival formulas; there is one signal with two components. The aggressive component is the cumulative volume delta every order-flow trader already knows; the passive component is the stack/pull behaviour of the resting book.

Readings are never smoothed or filtered. The only redraws are ones you trigger by changing a setting; see changing the core line and switching modes.
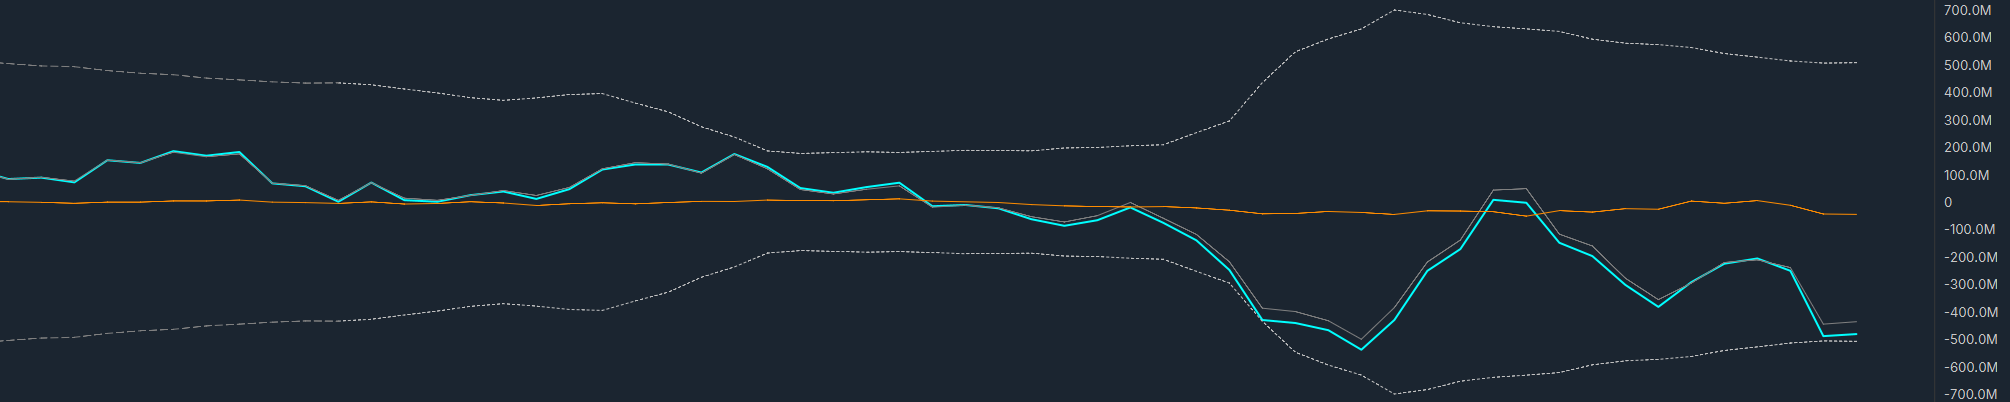
Total, Passive and Aggressive Flow on MotiveWave

Raw volume tells you what already traded. Flow shows what the order book is doing now: liquidity stacking up at a level, or quietly pulling away from it. It is context, not a forecast.

Depth: the headline signal measures the nearest levels per side, 10 by default (the Level Depth setting); a depth-1 variant of the same formula powers the deep-book warning.

The book itself is not flow. When an instrument's order book is first delivered (or re-delivered after a feed reconnect), the indicator treats that snapshot as the starting state rather than as stacking, so a book arriving as hundreds of individual inserts does not register as a burst of passive flow.

How the indicator reads MotiveWave's data. It reads every order book update MotiveWave delivers and counts each trade as a buy or a sell by the side MotiveWave reports for it. Off-exchange prints are not filtered out. Where order sizes are fractional (for example bitcoin), sizes are counted in millionths: 1 BTC reads 1,000,000.

Next: the σ readout

Chart images. The chart images on this site show the indicator's display on market data, to explain what it draws. They are not trading results or trade recommendations, and the risk and hypothetical performance disclosures above apply to them. We publish no trading performance. The full text is on the disclosures page.

← Getting started on MotiveWaveThe σ readout →

Order flow decomposed into one normalized signal. On Bookmap, MotiveWave and Sierra Chart.

contact@stacksignal.com
ProductOverviewPricingBookmap MarketplaceContact
DocumentationStart hereSignalsStates & alertsSettings referenceUpgrading from 2.xMethodology
ForWho it is forBookmapMotiveWaveSierra ChartOrder-flow traders
LegalPatent markingPrivacy policyIndicator privacy policyDisclosuresTerms of Sale

Risk disclosure. Futures and forex trading contains substantial risk and is not for every investor. An investor could potentially lose all or more than the initial investment. Risk capital is money that can be lost without jeopardizing one's financial security or lifestyle. Only risk capital should be used for trading and only those with sufficient risk capital should consider trading. Past performance is not necessarily indicative of future results. The possibility of profit is not equal to the possibility of loss: losses can be larger than any gains, and you can lose more than you invest.

The Pulling & Stacking Indicator is an analytical tool. It does not provide investment advice or trade recommendations, and nothing it displays is a signal to buy or sell.

Hypothetical performance disclosure. Hypothetical performance results have many inherent limitations, some of which are described below. No representation is being made that any account will or is likely to achieve profits or losses similar to those shown; in fact, there are frequently sharp differences between hypothetical performance results and the actual results subsequently achieved by any particular trading program. One of the limitations of hypothetical performance results is that they are generally prepared with the benefit of hindsight. In addition, hypothetical trading does not involve financial risk, and no hypothetical trading record can completely account for the impact of financial risk of actual trading. For example, the ability to withstand losses or to adhere to a particular trading program in spite of trading losses are material points which can also adversely affect actual trading results. There are numerous other factors related to the markets in general or to the implementation of any specific trading program which cannot be fully accounted for in the preparation of hypothetical performance results and all which can adversely affect trading results.

Chart images. The chart images on this site show the indicator's display on market data, to explain what it draws. They are not trading results or trade recommendations, and the risk and hypothetical performance disclosures above apply to them. We publish no trading performance.

Virtual currencies. Some chart images show cryptocurrency instruments. View CFTC advisories, as they contain more information on the risks associated with trading virtual currencies.

Trademarks. Stack Signal™ and Pulling & Stacking™ are trademarks of Stack Signal. Bookmap, MotiveWave and Sierra Chart are trademarks or registered trademarks of their respective owners. Stack Signal is not affiliated with, sponsored by or endorsed by those owners.

© 2026 Stack SignalPulling & Stacking Indicator: U.S. Design Patent Nos. D1,099,944 and D1,100,945 (stacksignal.com/patents/)

We’d like to set analytics cookies to measure which pages traders actually read. Nothing non-essential is set until you choose. No advertising trackers, ever. Privacy policy

Cookie preferences

Choose what we may set

You can change this at any time from “Cookie preferences” in the footer. Declining costs you nothing: the site works identically either way.

Strictly necessary

Keeps the site working and records this very choice. Cannot be switched off.

Always on

We set no advertising, retargeting, or cross-site tracking cookies, and we honour a Global Privacy Control signal automatically. Full cookie list in the privacy policy