The σ readout
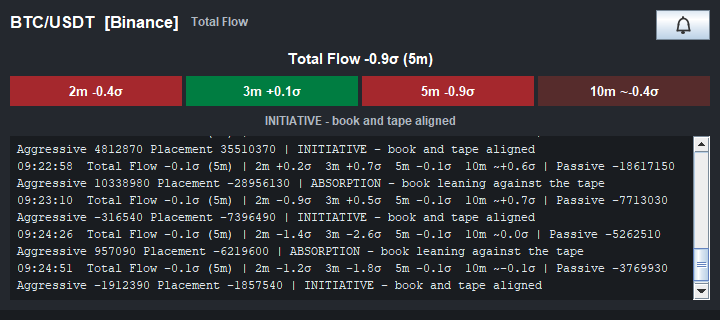
Raw flow in contracts is not comparable across symbols, sessions, or volatility regimes. The indicator therefore normalizes net flow by its own trailing variability: the readout shows how many standard deviations current flow sits from its recent norm, "Total Flow +4.2σ (5m)". The readout is for the line your chart trades from, the core line, and names it: "Placement Flow +1.2σ (5m)" on a chart set to Placement Flow.
- The band is computed over a lookback of 5× the flow window by default (25 minutes for the 5-minute window, 50 for the 10-minute window). The multiple and the band width are the S/R Lookback Multiplier and S/R Standard Deviations settings; see calibrating the parameters.
- Because each reading is measured against the instrument's own recent variability, a σ value can be compared across sessions and instruments in a way raw contract counts cannot. The defaults are a starting point: instruments differ in pace and book depth, so you may want to adjust the depth and band settings for the market you trade (see calibrating the parameters).
- Until the lookback is fully seeded the readout shows a shorter window that is
seeded, or a provisional estimate marked with
~; see warm-up stages.
The σ value heads each instrument's tile in the Pulling & Stacking Console and drives alert thresholds.
Next: the window ladder
Chart images. The chart images on this site show the indicator's display on market data, to explain what it draws. They are not trading results or trade recommendations, and the risk and hypothetical performance disclosures above apply to them. We publish no trading performance. The full text is on the disclosures page.