Buy & sell lines
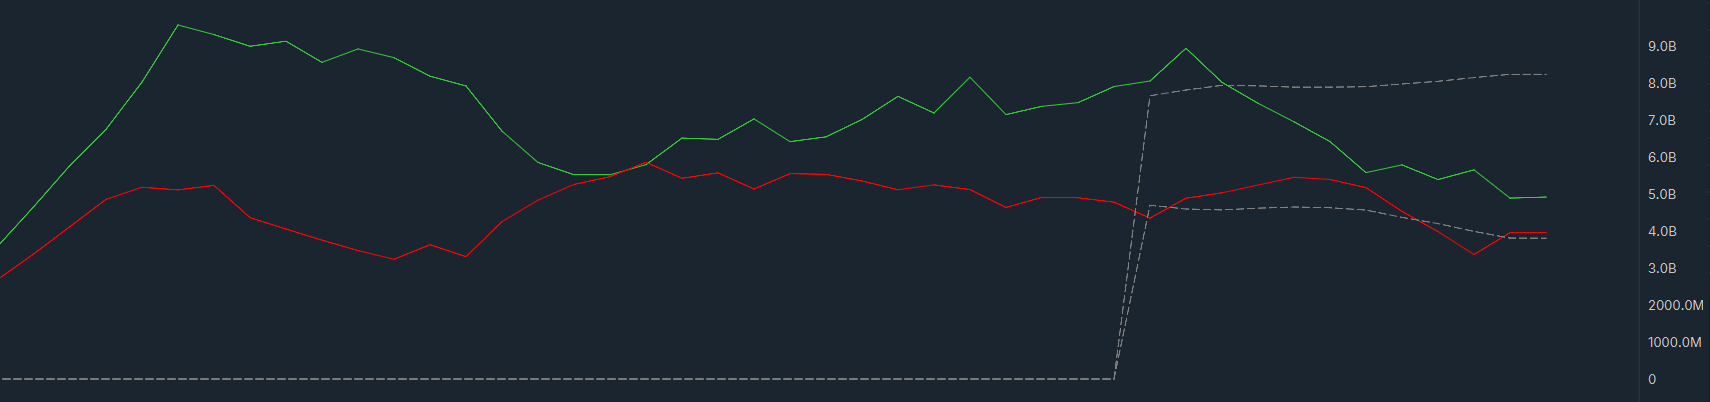
The Buy / Sell line mode plots the two sides of the passive flow as independent lines instead of only their net. One side going vertical while the other flatlines is a very different market from both rising together, and the net alone cannot tell you which is happening.
How to read them
- Buy Line (green): resting liquidity stacked (+) or pulled (−) on the bid side over the primary window.
- Sell Line (red): the same on the ask side.
- Both rising: two-sided stacking. The net may be near zero even though the book is busy.
- One rising, one flat: one-sided pressure. This is the case the net hides least well.
- Crossing: the leading side has changed.
Buy Line minus Sell Line is the Passive Flow line of the flow decomposition.
With executions or placement only
The Buy / Sell Lines setting chooses the pair:
- With executions (default): the two passive sides as they are. A trade removes resting size, so executions are in these lines. This is the readout of earlier versions.
- Placement only: each trade is added back to the side it consumed. Sellers hit bids, so sell volume returns to the Buy Line; buyers lift offers, so buy volume returns to the Sell Line. What remains is orders placed and cancelled, and Buy minus Sell is Placement Flow.
Resistance and Support are built from whichever pair is on screen. Changing the pair starts that band's warm-up again, over its full lookback.
The Delta line
The Delta Line is Buy Line minus Sell Line, the Delta line of version 2. It reads at a glance whether the balance between the two sides is growing or shrinking. With executions it equals Passive Flow; with placement only it equals Placement Flow.
It is off by default. Tick Show Delta Line on the Lines tab and click Update: it is drawn in white, with its full history. Its colour is under Colors on the same tab.
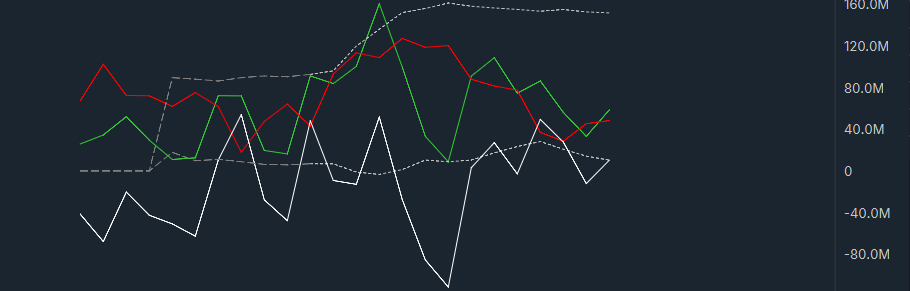
The Delta Line has its own scale and no band of its own: Buy/Sell Resistance and Support stay with the two sides, and it draws no arrows.
Resistance and Support
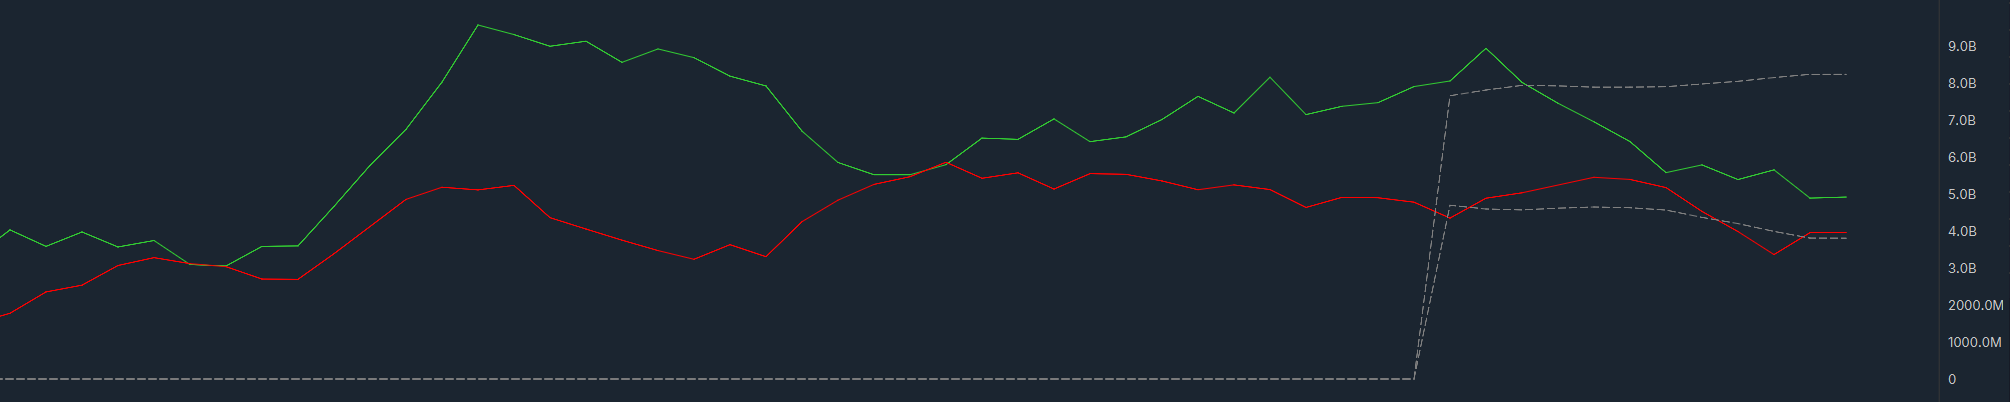
Both lines share one pair of dotted Buy/Sell Resistance and Buy/Sell Support lines: the average of the two sides' means, plus and minus the configured number of standard deviations (using the average of the two sides' standard deviations). See Support & Resistance for the two settings.
Setting it up
Choose Buy / Sell as the Line Mode on the Indicator Settings tab and
click Update. The lines are named Buy Line, Sell Line, Delta Line,
Buy/Sell Resistance and Buy/Sell Support. Choose the pair with Buy /
Sell Lines and switch the Delta Line on with Show Delta Line, both on the
Lines tab.
Next: the deep-book warning
Chart images. The chart images on this site show the indicator's display on market data, to explain what it draws. They are not trading results or trade recommendations, and the risk and hypothetical performance disclosures above apply to them. We publish no trading performance. The full text is on the disclosures page.